Supply Walls
Which walls are moving
Every coin that moves leaves the price where it last moved. Pick any week since 2012 to see how much moved, from which price, and whether it moved in profit or at a loss.
All time needs a free account. Continue with Google or use email.
Supply Walls · Explore
Loading the chart…
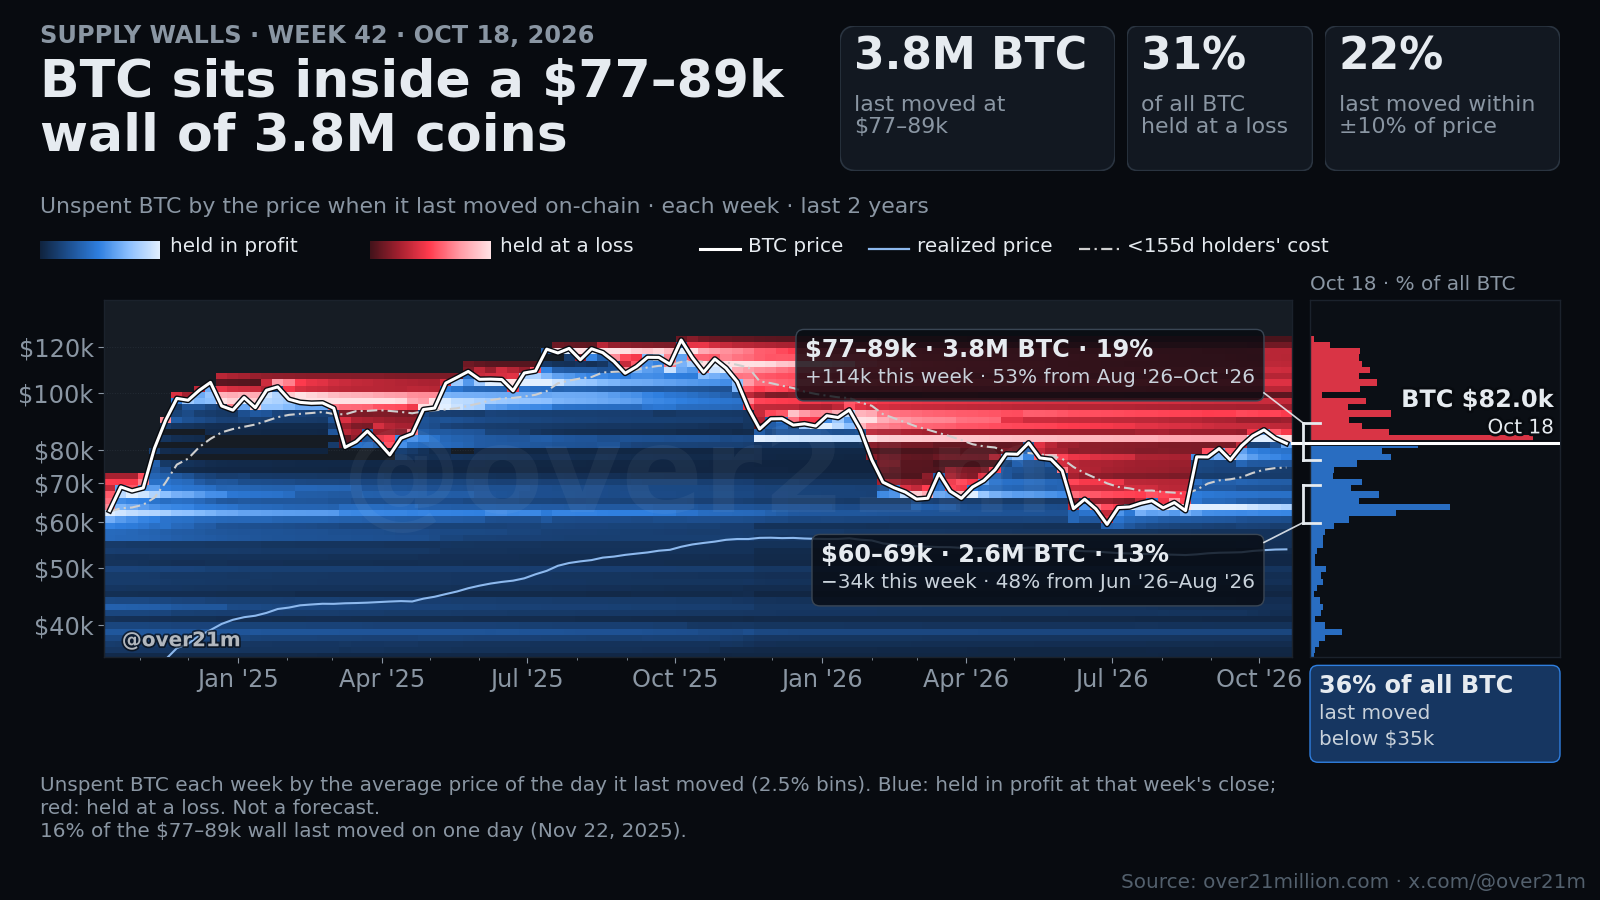
Each row of color is one age group of coins that moved in a week, drawn at the average price where those coins last moved. Blue moved in profit, red at a loss. Bars below: realized profit (up) and loss (down) in US dollars. Times in UTC. Not a forecast. Source: over21million.com · x.com/@over21m
Hover or tap the chart to pick a week; drag the bar under it to zoom. Arrow keys step through periods.
1.3M BTC (6% of all coins) last moved in a single 2.5% price band, $82.6k–$84.6k, right at price at $82.9k (Oct 20 close). Price sits inside the $77–89k wall of 3.9M BTC.
How to read it
Explore
- Each column is one week (one day on the 3-month to 1-year views). Each row of color is one age group of coins that moved then, drawn at the average price where those coins last moved.
- Blue rows moved in profit: they last moved below the price they moved at. Red rows moved at a loss. Brighter means more BTC.
- Red rows above the white price line are coins leaving walls overhead at a loss. Blue rows far below it are old coins moving in profit.
- The bars under the chart add it up in dollars: profit realized by the groups that moved in profit (up), and loss realized by the ones that moved at a loss (down).
Posted charts
- Every unspent bitcoin is placed at the average price of the day it last moved on-chain, from my own Bitcoin node.
- Blue is held in profit at that day’s close. Red is held at a loss. Brighter means more BTC.
- A wall is a large cluster of coins that last moved in one price range.
- Walls show where coins last moved. I tested whether walls stop price and found no evidence that they do.
Method and limits
- Cost basis is the average price of the day a coin last moved, in 2.5% price bins. Coins created before 2012 have no price record and sit in one placeholder bin.
- “Moved” means spent on-chain. Exchanges and custodians moving coins count too, so moved is not the same as sold.
- Explore shows one average price per age group, not every coin: what the group’s coins moved for, less their realized profit or loss, per BTC. The day’s average price stands in for each block’s, so the oldest groups’ prices are approximate.
- Age groups follow the coins’ age when they moved, from 1–2 days to 8+ years, as on Live charts.
- Daily close is the last 1-minute price of the UTC day. Data runs through the previous day’s close; Explore’s newest week or day is still filling.
- Not a forecast.
New Supply Walls every Monday (Sunday’s data). The zoom and what-if charts refresh mid-week on the mornings they’re posted.